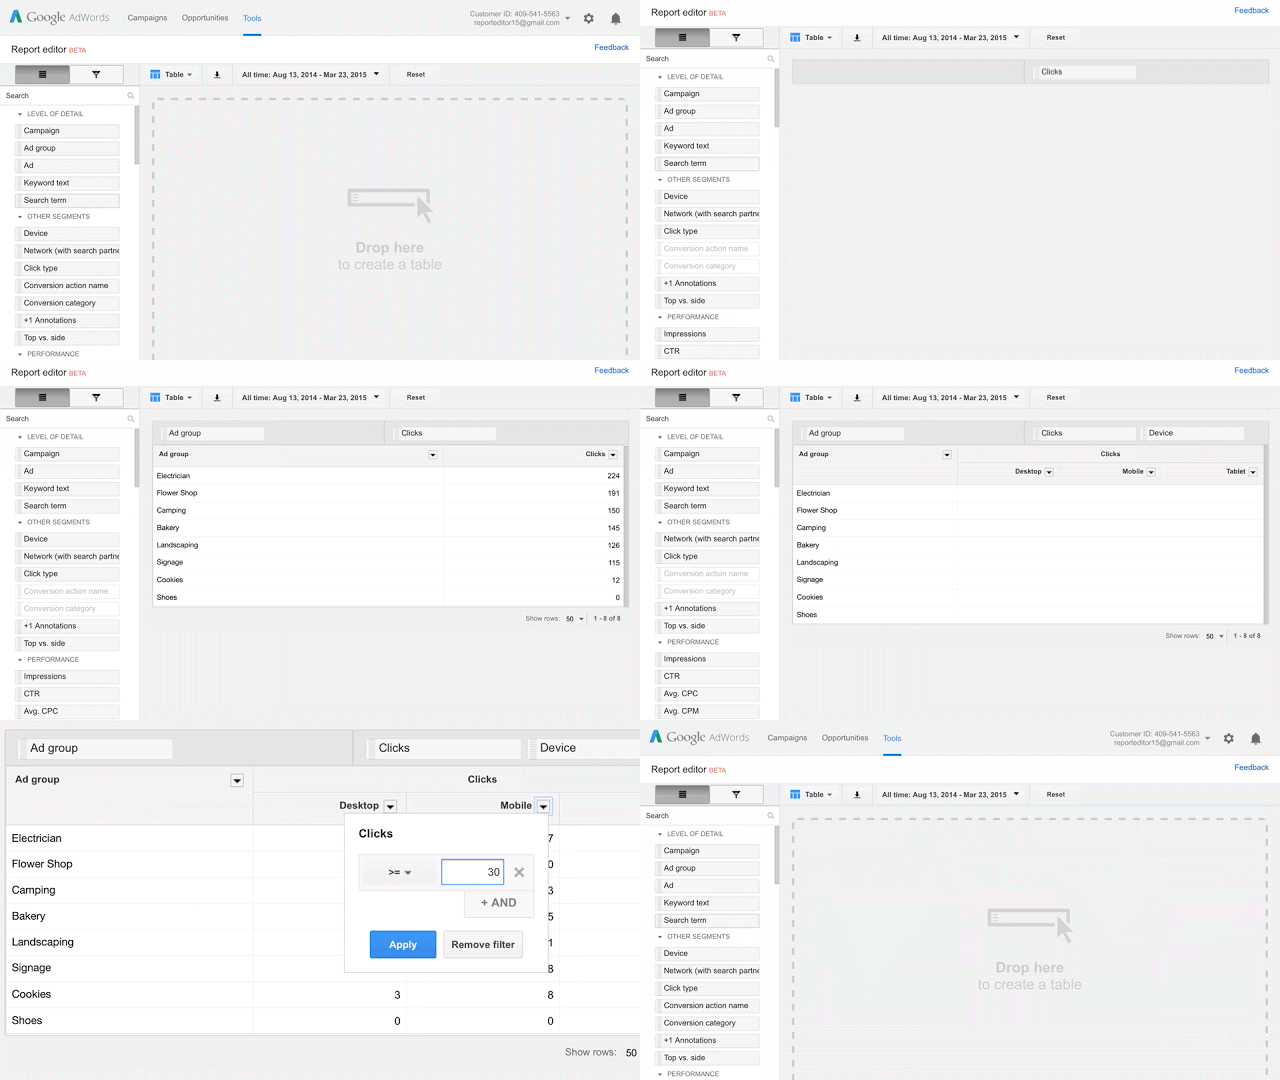
There was a lot of excitement on Twitter today as numerous AdWords advertisers tweeted about seeing a new Drag and Drop Report Editor in their accounts. Google first released this report in a few accounts as teasers last year in April and quickly retracted. According to Search Engine Land, AdWords Report Editor started showing up in various small-scale, low spend accounts over the past few months. Google said that the full rollout will not happen overnight and I personally wasn’t able to find it in any of the Google accounts I manage.
The AdWords Report Editor allows advertisers to create custom pivot tables and charts by simply dragging and dropping dimensions and metrics. It will be easy to filter out dimensions before the initial build, and an intuitive drop down makes it possible for advertisers to switch between visualization formats such as pie, table, line or bar charts.
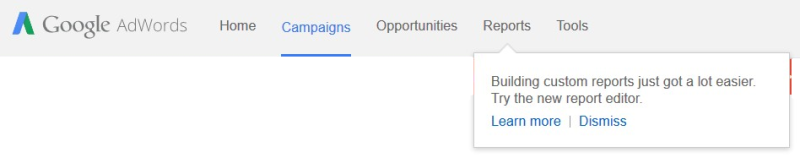
The Report Editor will appear as a Reports Tab at the top of the screen in-between the Opportunities and Tools tabs. Those who have seen it said there is an easy guide to walk you through the basics of how to use it.
Google produced this handy gif to illustrate how simple it is to create and filter reporting using the new AdWords Report Editor. The report comes with predefined templates to get you advertisers going or you can choose to start building from scratch.